Note: Mortgage rates have moved since this snapshot was published. The 30-year fixed now averages around 7.28 percent as of early October 2026.
The South Jersey housing market entered September 2026 in a familiar pattern. Prices kept climbing at a moderate pace. Inventory kept growing meaningfully. Mortgage rates stayed parked at about 6.7 percent. The most recent verified county-level data, from June 2026, shows Burlington County's median sale price near $430,000, up 2.4 percent from a year earlier. Camden County came in at $375,000, up 1.4 percent. Gloucester County landed near $384,000 to $385,000, up 2.7 to 3.7 percent. Here is what those numbers mean for your next move.
This is the first in a weekly series of South Jersey market snapshots. Each week I pull the freshest verified numbers I can find across Burlington, Camden, and Gloucester Counties, rotate through the towns I watch closely, and explain what the data means for buyers and sellers in plain language. No hype and no predictions dressed up as facts. Just what the data shows today.
The Headline Numbers This Week
The latest county-wide readings come from June 2026, the most recent figures published by the sources I track. Here they are:
| County | Median Sale Price | YoY Change | Days on Market | Active Inventory vs. Last Year |
|---|---|---|---|---|
| Burlington County | About $430,000 | +2.4% | About 16 days | +20.5% |
| Camden County | $375,000 | +1.4% | About 14 days | Tight supply |
| Gloucester County | About $384K to $385K | +2.7% to +3.7% | About 13 days | +13.7% |
Data source: Redfin, Zillow, and local market reports, June 2026 county-level figures, verified September 2, 2026. These are the most recent county-wide numbers published; official late-2026 figures are not available yet. Actual prices vary widely by town, neighborhood, property condition, and home type.
What the Inventory Story Means for Buyers
Burlington County's active inventory sat about 20 percent higher than a year earlier in June, and Gloucester County's was up about 14 percent. That is the headline number for buyers this month: there are simply more homes to choose from than at any point since rates first jumped. Closed sales in Burlington were still running below last year, which in plain English means demand has cooled from the frenzy, not collapsed.
For buyers,that translates into a little more time and a little more leverage. More properties means more chances to find one that actually fits, rather than settling for whatever got listed that week. Sellers are more likely to negotiate minor repairs, closing costs, or rate buydowns than they were a year or two ago. That does not mean you can lowball everything: days on market are still short in the most desirable towns. Roughly half of homes across the region still sell at or above list price. Come prepared with a pre-approval, tour promptly, and be ready to move when the right home appears. Reading how to read a market report helps you tell a real opportunity from a misleading headline.
What the Same Data Means for Sellers
If you are selling,the inventory increase is the competitive pressure to watch: your home is now competing against about a fifth more listings in Burlington County than it was last June. Buyers have choices, so pricing accuracy matters more, not less.
The good news: prices are still up year over year in every county I track this week. Well-priced, move-in-ready homes in popular towns still go under contract quickly, often in under two weeks. Roughly half of homes in Burlington, and Gloucester Counties, and about 55 percent in Camden County still sell above list price, so demand is real in the right price bands. The strategy shift is simple: price it right from day one, present it well, and let the market work. Homes priced above comparable sales are the ones sitting, and a price cut later costs far more than a realistic price now. See the full Burlington County market report for a deeper dive into pricing, days on market, and seasonal strategy.
Interest Rate Update: September 2026
National average mortgage rates, pulled September 1-2, 2026, sit at roughly:
- 30-year fixed: about 6.7 percent
- 15-year fixed: about 5.9 percent
- 30-year FHA: about 5.4 percent interest, or roughly 6.1 percent APR
- 30-year VA: about 6.2 to 6.3 percent
These are national averages; your actual rate depends on your credit score, down payment, points, lender, and state. The direction matters more than the decimal: rates have been drifting around the high-6 percent range rather than spiking,which gives buyers more confidence to plan a purchase without fearing a sudden jump.
Here is the math in plain terms: on a $400,000, 30-year fixed loan, principal and interest at about 6.7 percent runs roughly $2,580 per month, while the same loan around the FHA neighborhood of about 5.4 percent runs roughly $2,245 per month, a difference of roughly $335 a month. Taxes and insurance add on top,but the rate picture is why getting quotes, and comparing APRs matter. My mortgage rates explained guide walks through how these numbers affect your buying power.
Market Spotlight: Medford
This week's spotlight rests on Medford, one of Burlington County's most distinctive markets. Medford's median sale price ran roughly $600,000 to $625,000 in mid-2026, depending on the source, and window, with a Redfin reading of about $603,000, up about 12 percent year over year. The town consistently outpaces many of its neighbors because buyers pay a premium for lot size, privacy, top-tier schools, and that equestrian lifestyle you will not find in denser suburbs.
What that means in practice: Medford is not a bargain market, but it is a value market in the sense that the housing stock holds up well and does not sit. Well-priced colonials, and estate homes on larger lots go under contract quickly, and Medford Lakes lakefront properties remain among the most eagerly awaited listings in the county. Buyers should be pre-approved before touring; sellers should understand that luxury, and estate buyers are highly sensitive to condition, and presentation,so staging, and pre-listing inspections pay off here more than in most towns.
How the Towns Are Shaping Up This Week
Each week I rotate through a handful of towns across the three counties. This week's verified readings, pulled from mid-2026 figures:
| Town | Median Sale Price | YoY Change | Source / Window |
|---|---|---|---|
| Medford (08055) | About $603,000 | +12.1% | Redfin, mid-2026 |
| Marlton (08053 | About $477K to $496K | +2.6% to +10.8% | Redfin / RealtyTrac, mid-2026 |
| Cinnaminson (08077) | About $437K to $449K | +2%to +4.7% | Redfin / Homes.com, mid-2026 |
| Bordentown (08505) | About $462,400 | +7.5% | Redfin, June 2026 |
| Haddonfield (08033 | About $862,000 | +13.4% | Redfin, June 2026 |
Figures vary by source and averaging window,so treat each as a range around the middle rather than a precise appraised value. Always compare the same metric year over year before drawing conclusions.
Town-by-town guides give more color on each market: Marlton, Cinnaminson, Bordentown, and Haddonfield. If you want to compare towns head to head,Medford versus Marltonand Moorestown versus Marlton are good starts
What Changed Since the Last Market Report
The full 2026 South Jersey market analysis presents the year's broader picture, and the Burlington County report drills into the county. The freshest change in the data this month is the inventory story: Burlington County's active listings were about a fifth higher than a year earlier, and homes selling over list price have cooled from about 58 percent a year ago to about 48 percent. Translation: the market is still tilted toward sellers in popular price bands, but it is a more balanced,more negotiable market than South Jersey buyers have seen in years.
Frequently Asked Questions
What is the median home price in South Jersey right now?
Is now a good time to buy a home in South Jersey?
Are South Jersey home prices rising or falling?
Get a Personalized Read on Your Market
County averages are a starting point,but your street,your price range, and your timeline are what actually matter. If you are thinking about buying or selling anywhere in South Jersey,I am happy to walk you through the latest data for your specific situation,with real comparables, and honest advice. No pressure,no obligation.
Contact Bob or schedule a call to get started.
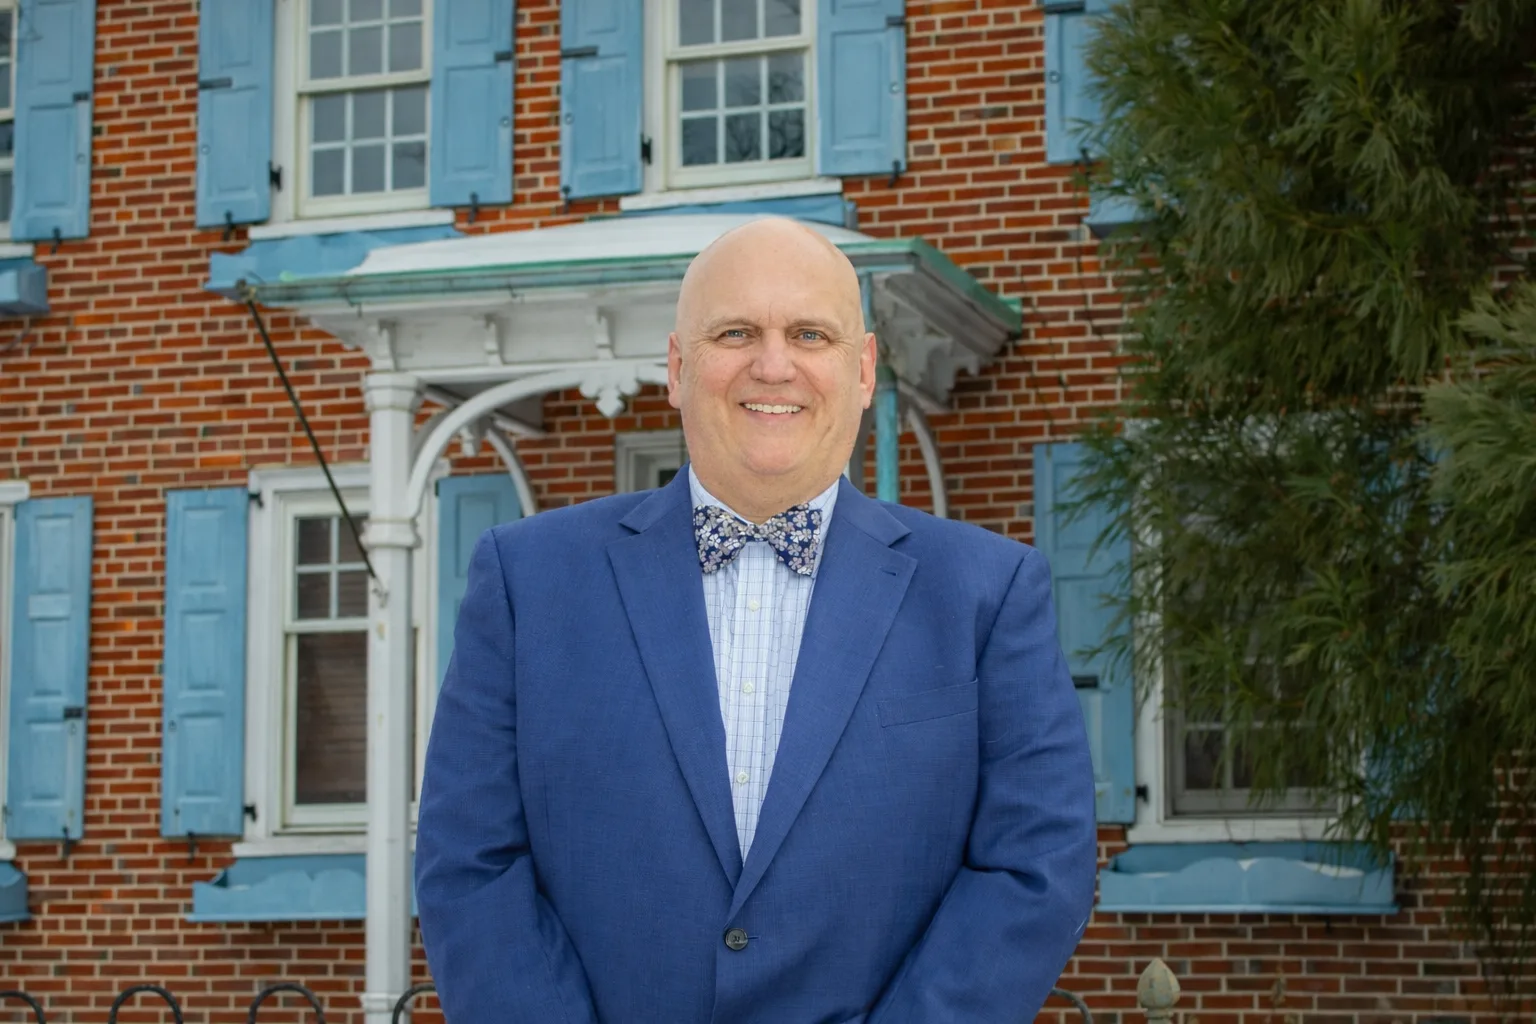
Bob Millaway
Epique Realty Agent · AI Certified Agent™ · 728+ homes sold across Burlington County and South Jersey. Each week I researchand publish the latest verified market data so buyersand sellers can make confident,educated decisions.
Contact Bob