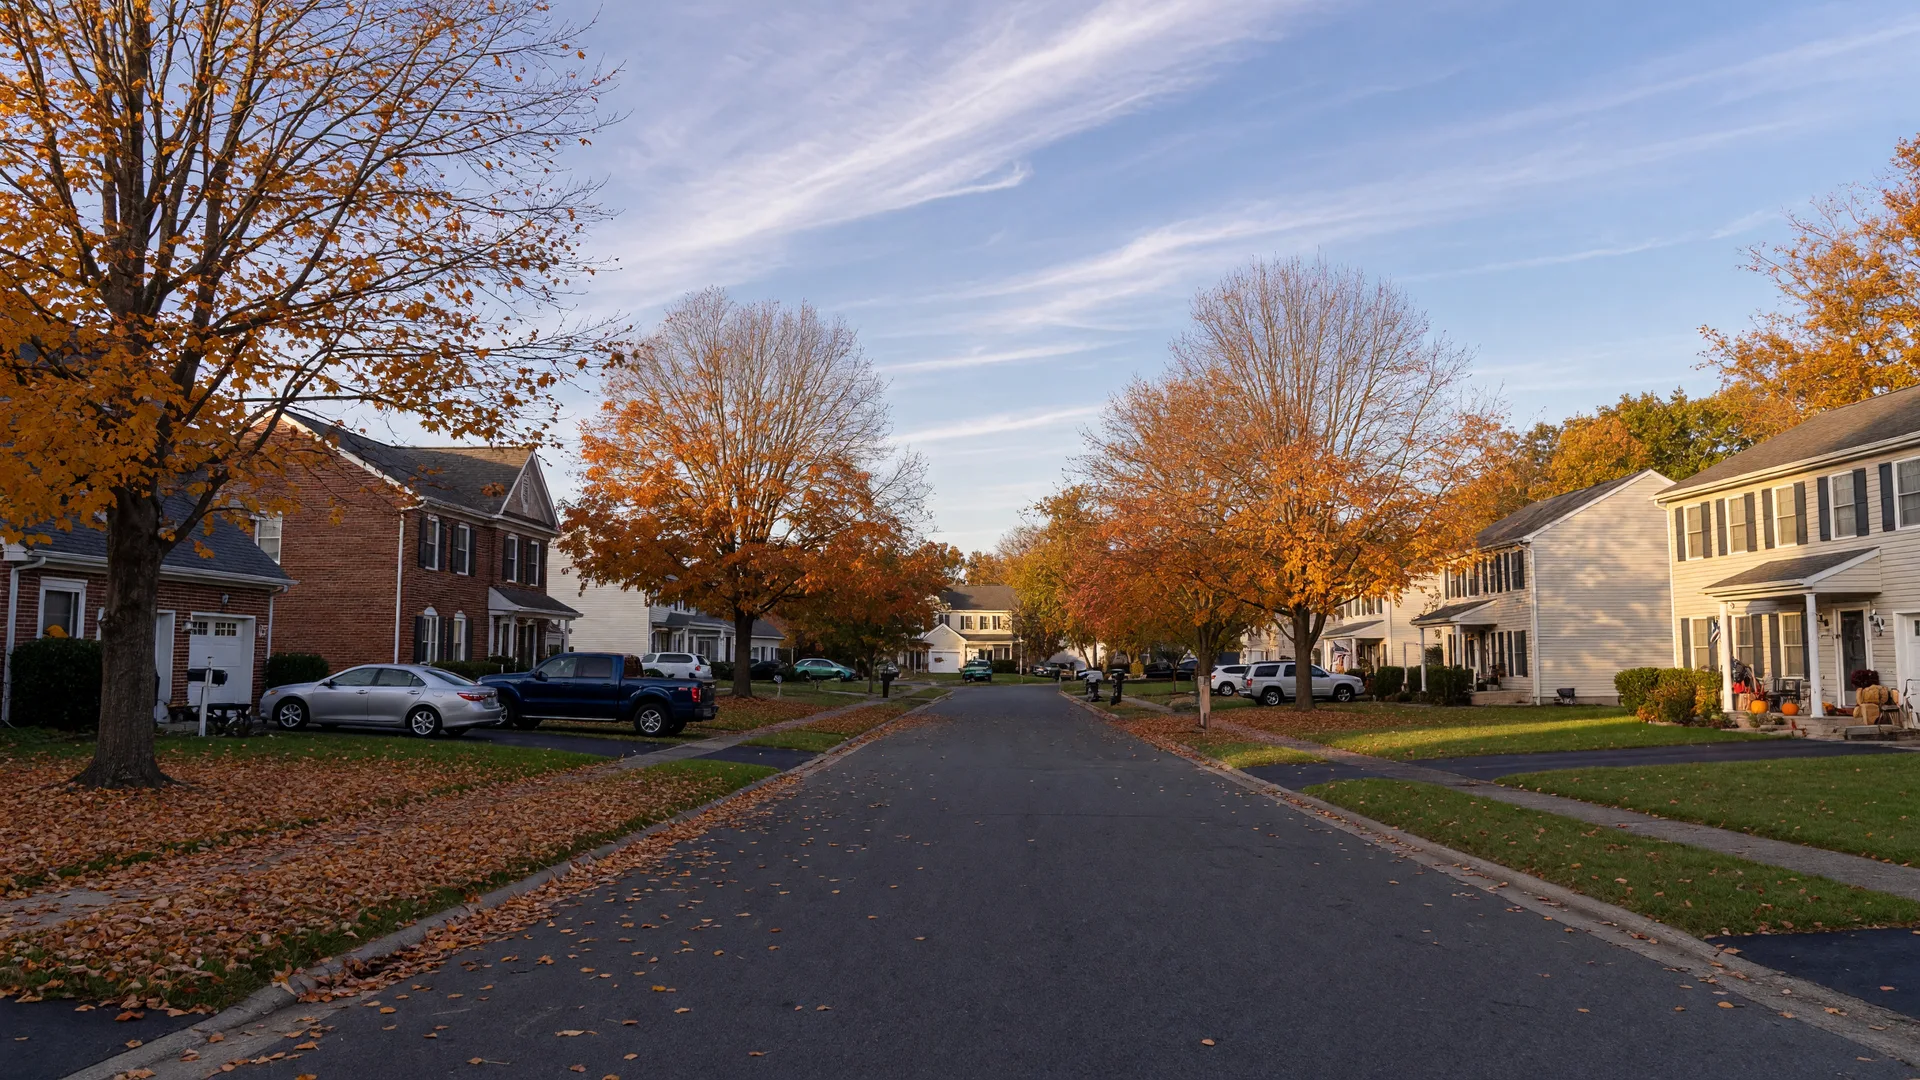
The big story this month: mortgage rates have climbed back above 7 percent. As of the week of October 8, 2026, the national average 30-year fixed rate was 7.40 percent, up from 7.28 percent the week before.
South Jersey's housing market entered October 2026 in a familiar pattern with one important twist. Prices are still rising at a moderate pace, and inventory is still growing, but mortgage rates have crossed back above 7 percent after a stretch in the high 6s. The most recent verified county-level data shows Burlington County's median sale price near $430,000, up 2.4 percent from a year earlier, with the newest readings for Camden County at $376,950, up 4.7 percent, and Gloucester County near $390,000, up 2.6 percent. Here is what those numbers mean for your next move.
This is the next edition of the South Jersey market snapshot series. Each month I pull the freshest verified numbers I can find across Burlington, Camden, and Gloucester Counties, rotate through the towns I watch closely, and explain what the data means for buyers and sellers in plain language. No hype, and no predictions dressed up as facts. Just what the data shows today.
What Happened to Mortgage Rates in October 2026?
Rates moved higher in October, and that is the single most important change since September's snapshot. According to Freddie Mac's Primary Mortgage Market Survey for the week of October 8, 2026, the national average 30-year fixed rate was 7.40 percent, up from 7.28 percent the prior week. The 15-year fixed averaged 6.73 percent. For FHA buyers, independent surveys show the 30-year FHA rate around 7.18 percent as of mid-October.
This did not happen overnight. Rates first crossed back above 7 percent in September 2026, and the climb since then is why lenders and analysts have started calling 7 percent the new normal. New Jersey average rates ran roughly 7.1 to 7.5 percent in October, depending on the lender and loan program.
Here is the payment math in plain terms. On a $400,000, 30-year fixed loan at about 7.4 percent, principal and interest runs roughly $2,770 per month. At the 6.7 percent we were quoting at the start of September, the same loan ran roughly $2,580. That is about $190 a month more, or roughly $2,280 more a year, for the same home. Taxes and insurance add on top. My mortgage rates explained guide walks through how these numbers shape your buying power, and the rate update from early October covers the rise in more depth.
What Do the Latest County-Level Numbers Show?
County-wide medians and inventory come from different reporting windows, so I want to be transparent about which month each figure covers. Burlington County's most recent verified figures are from June 2026, while Camden County has September data and Gloucester County has August data. Here they are:
| County | Median Sale Price | YoY Change | Days on Market | Data Window |
|---|---|---|---|---|
| Burlington County | About $430,000 | +2.4% | About 16 days | June 2026 |
| Camden County | $376,950 | +4.7% | About 19 days | September 2026 |
| Gloucester County | About $390,000 | +2.6% | About 18 days | August 2026 |
Data source: Bright MLS figures and county market reports as published by local brokers, Redfin, and Zillow, verified October 15, 2026. Official fourth-quarter county figures are not published yet, so these are the most recent county-wide readings available. Actual prices vary widely by town, neighborhood, property condition, and home type.
Inventory tells the other half of the story. Burlington County's active inventory was about 1,041 homes in June, roughly 20 percent higher than a year earlier, and homes were going pending in about 15 days. Gloucester County active inventory reached about 766 homes in August, up 14 percent year over year. Camden County's supply is tighter, with inventory running only a few percent above last year and months of supply near 2.5, well below the 5 to 6 months that defines a balanced market. For a fuller look at Burlington County, see the Burlington County market report.
What Does All This Mean for Buyers?
The higher rate is the headline, but the inventory picture is quietly good news. More homes are available in Burlington and Gloucester Counties than at any point since rates first jumped, which means buyers have more choices and a little more room to negotiate than they did a year ago. Sellers are more willing to discuss concessions, rate buydowns, and minor repairs than they were in the hottest stretch of the market.
The honest trade-off: your monthly payment costs more now, so the same budget buys a little less home than it did in August. That makes getting pre-approved before you tour more important than ever, and it makes the town and price-band choices sharper. Roughly half of homes across the region still sell at or above list price in the most desirable towns, so you still want to move promptly on a home that truly fits. My full look at whether now is a good time to buy walks through the readiness question, and learning how to read a market report helps you tell a real opportunity from a misleading headline.
What Does All This Mean for Sellers?
Prices are still up year over year in every county I track, and the best-condition, best-priced homes in popular towns still go under contract quickly. But the competitive backdrop has shifted. With rates above 7 percent, buyers are more payment-sensitive and more selective, and homes priced above comparable sales are the ones sitting.
In plain terms: pricing accuracy matters more now, not less. A home priced right from day one, presented well, with the repairs buyers care about already handled, still commands strong attention. An overpriced listing costs you the first two weeks of a listing, which are almost always the most valuable. My data-driven look at the seller market covers this in more detail, and the fall 2026 outlook shows how the season is shaping up town by town.
What Is the Moorestown Market Doing Right Now?
This month's spotlight falls on Moorestown, Burlington County's flagship premium town. Moorestown's Q2 2026 figures, from the Bright MLS data in my Burlington County market report, show a median sale price of about $785,000 in the 08057 ZIP, up 0.4 percent year over year, with a strong 99.4 percent sale-to-list ratio and 55 sales closed in the quarter. Homes spent about 45 days on market, which tells you Moorestown buyers are thorough, not hasty.
I want to be honest about the data here. Trackers do not always agree on Moorestown, because they use different averaging windows. Redfin's Moorestown-Lenola page, which looks at a trailing three months, shows a lower median around the high $500,000s, down year over year. When numbers diverge this much, the zip-code-level, source-consistent comparison is the one to trust. What both agree on: Moorestown is a high-value, stable market where location, lot, and condition drive the sale, and where the premium is built on schools, the historic village, and proximity to Philadelphia. The living in Moorestown guide and the dedicated Living in Moorestown site give the fuller lifestyle picture.
What Has Changed Since September's Snapshot?
Three things stand out since the September snapshot. First, mortgage rates moved from about 6.7 percent at the start of September to 7.40 percent by early October, the largest single shift. Second, statewide inventory keeps climbing, with New Jersey homes going under contract in roughly 19 days and months of supply still well short of a balanced market. Third, buyer behavior is changing: more requests for concessions, more rate buydowns, and a sharper focus on monthly payment.
None of this is a crash, and none of it is a frenzy. It is a market normalizing after an unusual stretch, and for most buyers and sellers that simply means preparation and pricing accuracy now decide the outcome more than luck. If you want the town-level read for your specific situation, I am always happy to run the numbers with you, no pressure and no obligation.
Frequently Asked Questions
What is the median home price in South Jersey right now?
Are mortgage rates above 7 percent the new normal?
Is South Jersey a buyer's market or a seller's market in 2026?
Get a Personalized Read on Your Market
County averages are a starting point, but your street, your price range, and your timeline are what actually matter. If you are thinking about buying or selling anywhere in South Jersey, I am happy to walk you through the latest data for your specific situation, with real comparables and honest advice. No pressure, no obligation.
Contact Bob or schedule a call to get started.
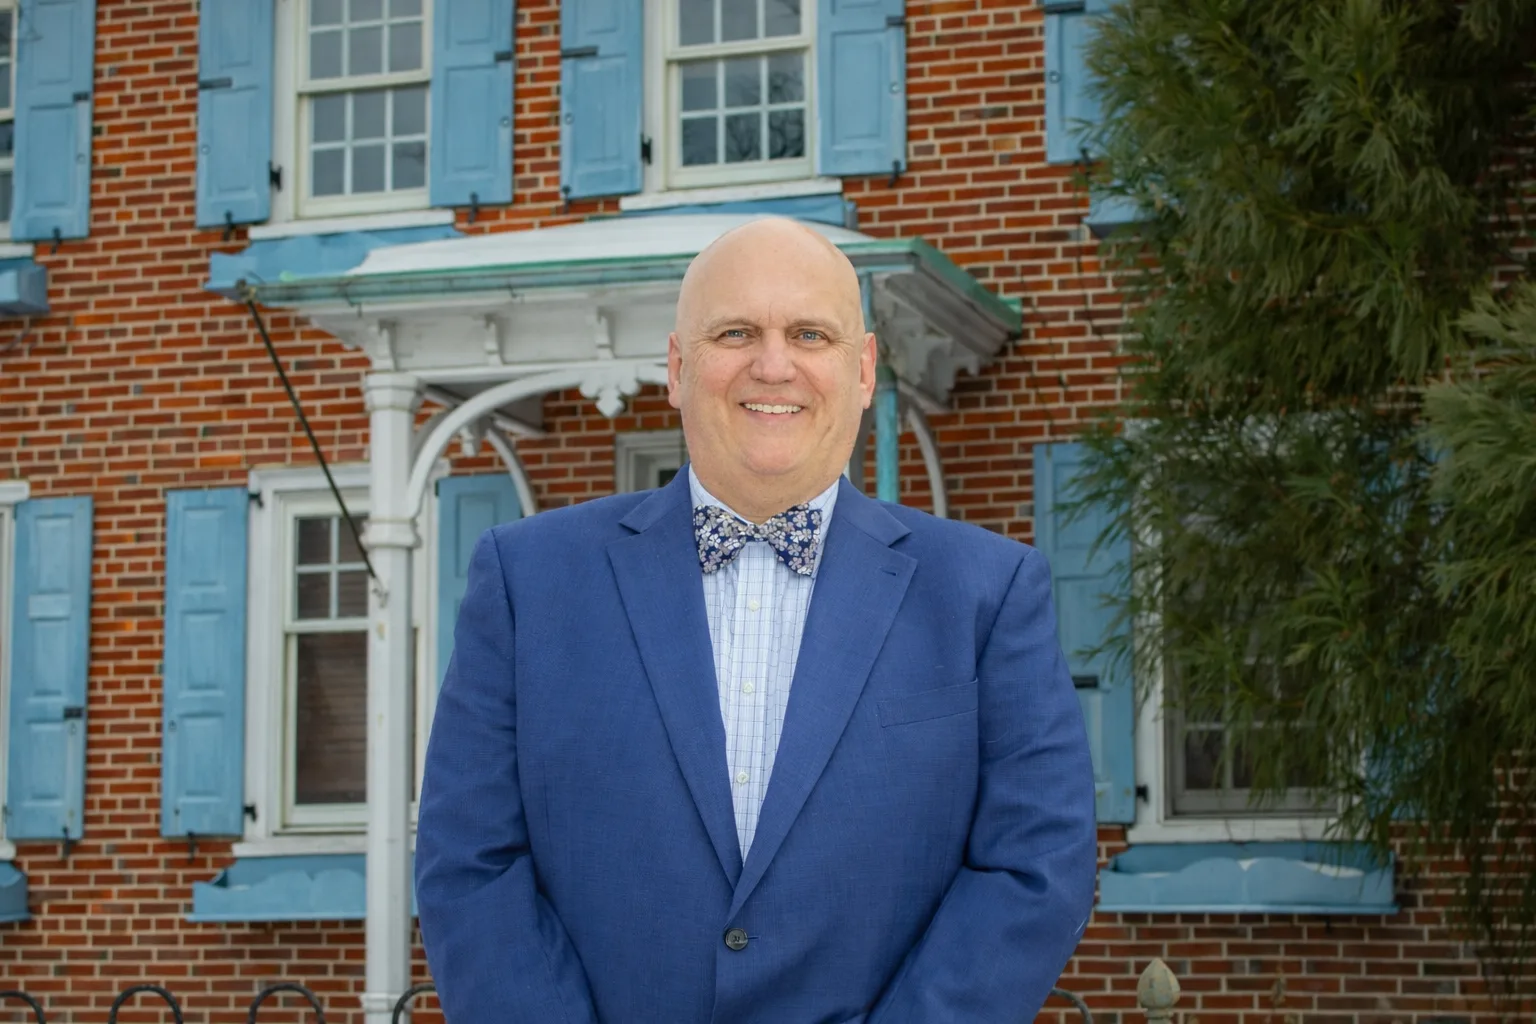
Bob Millaway
Epique Realty Agent, AI Certified Agent. New Jersey Salesperson, license 791082. 856.426.1522. Each month I research and publish the latest verified market data so buyers and sellers across Burlington County and South Jersey can make confident, educated decisions.
Contact Bob